Problem and outcome
Machine learning models fail in production in ways that are easy to miss and expensive to ignore: input distributions drift, features disappear, latency spikes, labels arrive late, and attackers probe for leakage or abuse. A monitoring pipeline that only tracks uptime or average accuracy is not enough. You need a secure ML model monitoring pipeline that can collect model health signals, validate them, protect the data they contain, and alert on both operational regressions and security anomalies.
By the end of this tutorial, you will know how to design and validate a pipeline that ingests model metrics, feature statistics, prediction logs, and security signals; stores them with least privilege; evaluates drift and integrity checks; and produces actionable alerts without exposing sensitive data. You will also know what to verify before putting the pipeline into production.
What you are building
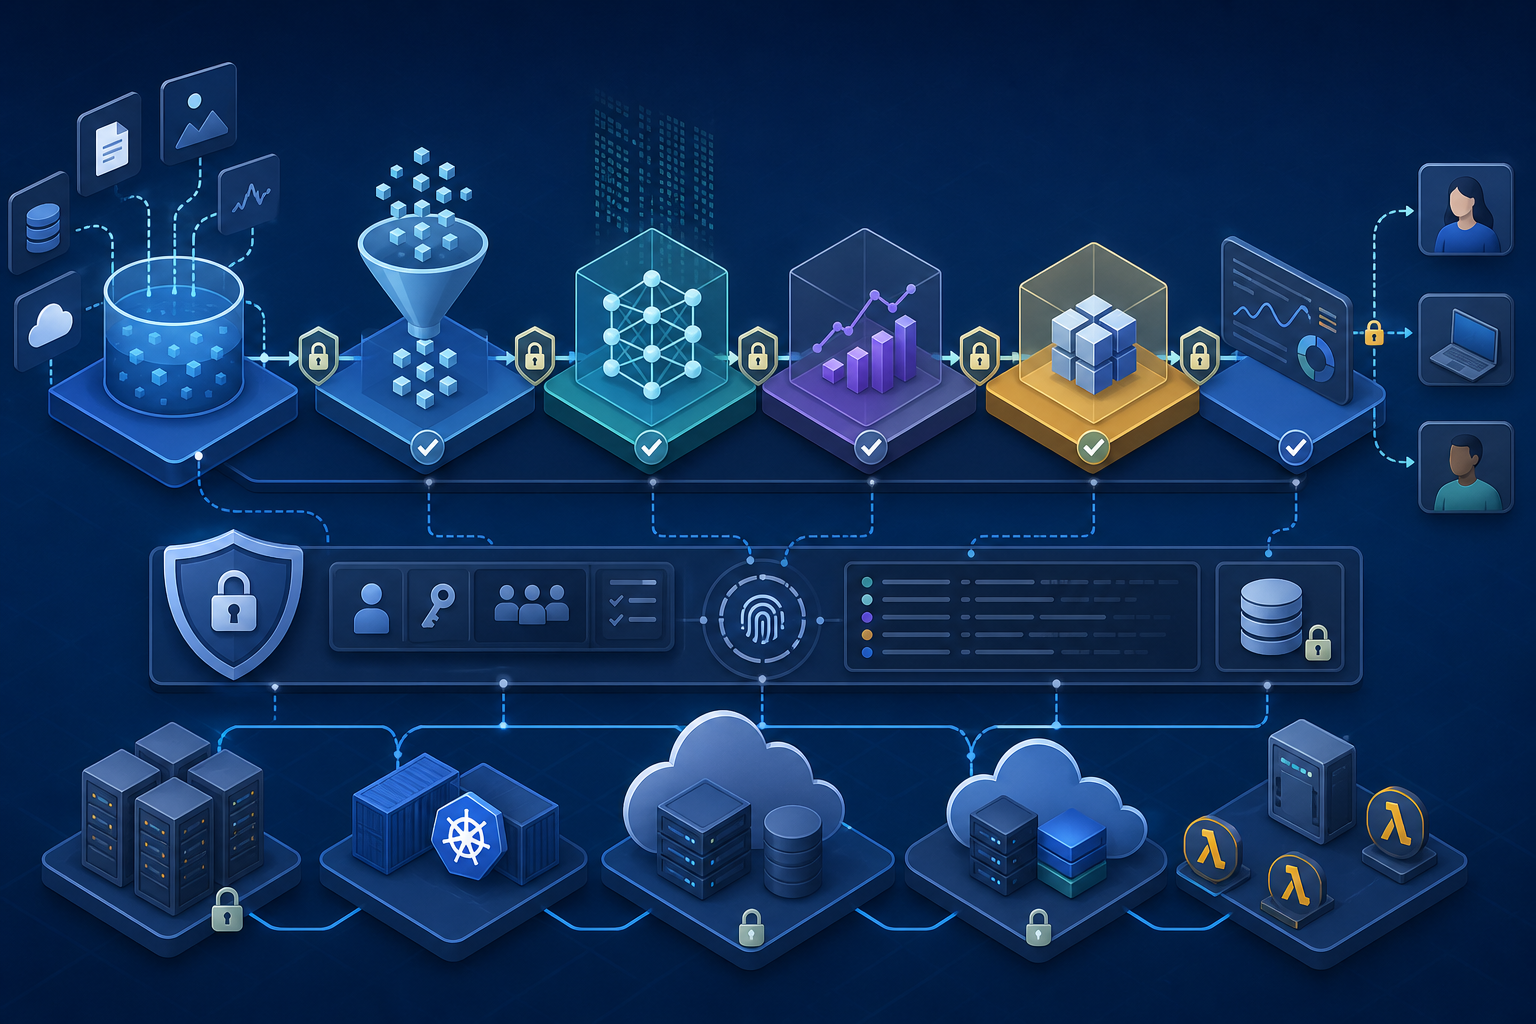
The finished state should look like this:
- Model inference emits a minimal telemetry event with request metadata, feature summaries, prediction output, model version, and a correlation ID.
- A collector or message queue receives events and forwards them to a validation stage.
- The validation stage checks schema, redacts sensitive fields, and rejects malformed or suspicious payloads.
- A metrics job computes drift, missingness, latency, error rates, and distribution changes.
- A security job detects unusual access patterns, excessive retries, source anomalies, and tampering signals.
- Results are written to a protected store and surfaced through alerts, dashboards, or incident tickets.
If you already have deployment controls in place, this monitoring layer complements them. If you still need to secure the deployment path itself, How to Deploy Secure ML Models with Containerized Pipelines is a useful companion because build and release controls affect what your monitoring layer should trust.
Prerequisites and stop-here-if warnings
Before you start, confirm the following prerequisites.
Required capabilities
- You can modify the inference service to emit telemetry or logs.
- You have a secure destination for metrics and logs, such as a time-series store, log platform, or object store with access controls.
- You can schedule batch jobs or stream processors for validation and aggregation.
- You have a way to compare live data against a baseline, usually from the training set or a reference window.
- You can send alerts to an on-call or incident system.
Stop here if any of these are true
- You do not know which features are allowed to be logged. Fix your data handling policy first.
- Your model serves regulated or highly sensitive data and you cannot enforce field-level redaction or tokenization.
- You cannot identify a stable baseline for drift comparison. A monitoring pipeline without a reference is mostly noise.
- You cannot trace model version, feature version, and deployment version together. Without lineage, incident investigation becomes guesswork.
- You do not have authorization to store inference data, even in summarized form. Solve the legal and privacy constraints before instrumentation.
Design the monitoring signal set
Goal
Define exactly which signals the pipeline will observe so you can measure model health without collecting unnecessary sensitive data.
Action
Choose a small, explicit set of signals:
- Input schema version and feature presence
- Feature statistics such as min, max, mean, standard deviation, and missing rate
- Prediction score or class distribution
- Confidence or margin, if available
- Latency, timeout, retry, and error counts
- Model version and deployment identifier
- Request source metadata that is safe to store, such as service account or internal client ID
- Security indicators such as auth failures, impossible request rates, or payload size outliers
Avoid storing raw payloads unless you have a defined reason and a controlled retention policy. In many environments, feature summaries and hashed identifiers are enough to detect problems.
Expected output
A written telemetry spec that defines:
- Which fields are emitted
- Which fields are redacted or hashed
- Which fields are optional versus required
- Retention periods for raw and aggregated records
- Ownership for the monitoring data
Validation
Review the spec against privacy and operational requirements. Ask these questions:
- Can this signal detect the failure mode it is meant to catch?
- Does any field expose secrets, PII, or payloads that should not be logged?
- Can the signal be used to reconstruct sensitive inputs?
- Is the signal stable enough to compare across deployments and versions?
Common failure
Teams often log everything “for debugging” and later discover that the monitoring store contains sensitive customer data. Another common failure is collecting only aggregate metrics, which makes incident response slow because you cannot tie anomalies back to model version or request source.
Instrument the inference path
Goal
Emit structured telemetry from the model serving layer in a way that is easy to validate, query, and secure.
Action
Use structured logs or events instead of free-form text. Include a correlation ID, model version, and a sanitized feature summary. Keep the payload minimal and deterministic.
A simple JSON event might look like this:
{
  "timestamp": "2026-07-23T12:00:00Z",
  "request_id": "c7c8f0f4",
  "model_version": "fraud-model-v18",
  "feature_schema_version": "2026-07",
  "source": "internal-api",
  "latency_ms": 42,
  "prediction": 0.91,
  "feature_stats": {
    "age": {"missing": false, "value_bucket": "30-39"},
    "amount": {"missing": false, "value_bucket": "100-499"}
  }
}
Use value bucketing or summary statistics when exact values are not needed. If you must include identifiers, hash or tokenize them and define the key management process separately.
If you are also exposing model outputs through an API, pair this pipeline with runtime request controls. How to Secure AI Model APIs with Runtime Monitoring is relevant when request abuse, prompt injection, or unusual query patterns are part of the threat model.
Expected output
Every inference request produces a structured event, or a sampled subset if volume is high and sampling is explicitly defined.
Validation
Check that the event is parseable, schema-compliant, and consistent across model versions. Confirm that the telemetry still works when the model returns errors, timeouts, or fallback predictions.
Common failure
A frequent failure is adding logging after the prediction is returned but before error handling. That means failed requests disappear from the monitoring pipeline, which hides the very issues you want to detect.
Build a secure ingestion and validation stage
Goal
Make sure only well-formed, authorized, and sanitized telemetry reaches your storage and analytics layers.
Action
Route events through a collector, queue, or stream processor that can validate input before storage. Apply these controls:
- Schema validation against a versioned contract
- Field allowlists instead of broad acceptance
- Redaction or tokenization for sensitive values
- Message size limits
- Authentication and authorization for producers
- Replay protection or idempotency keys, if applicable
- Integrity checks such as message signing or transport-level protections
Keep raw and processed streams separate if you need both. Raw streams should have tighter access controls and shorter retention.
A practical rule is: if an event fails validation, discard or quarantine it rather than storing it in the main monitoring index.
Expected output
A validation stage that rejects malformed events, tags suspicious ones, and forwards only approved telemetry to downstream storage.
Validation
Test the validator with:
- Missing required fields
- Unexpected field names
- Oversized payloads
- Invalid data types
- Known sensitive values that should be redacted
- Duplicate or replayed messages
Confirm that failures are visible in a separate audit stream and that the rejection path does not leak payload contents.
Common failure
The most common mistake is trusting inference logs because they come from an internal service. Internal traffic still needs validation; compromised workloads, misconfigurations, and noisy clients can all poison monitoring data.
Compute health, drift, and security checks
Goal
Turn raw telemetry into signals that indicate whether the model is healthy, drifting, or under suspicious use.
Action
Implement two categories of checks: model health checks and security checks.
Model health checks
- Data drift on key features compared with a baseline window
- Prediction drift or class imbalance changes
- Missing-value spikes
- Latency percentiles and timeout rate
- Error rate by model version and source
- Feature-schema mismatch rate
Use a baseline that is appropriate for the deployment. For a stable model, compare live traffic to the training distribution or to a recent healthy window. For seasonal workloads, compare to the same time period from a previous cycle.
Security checks
- Sudden increases in requests from a single source
- Repeated authentication failures
- Unusual geographic or network-origin patterns, if available and permitted
- Payload size anomalies
- Attempted schema violations or malformed event bursts
- Unexpected model-version access after deprecation
If your pipeline can calculate thresholds, set them conservatively at first. Prefer alerting on sustained anomalies rather than one-off noise.
Expected output
A set of metric jobs or rules that produce clear indicators such as drift score, anomaly score, and SLA breach flags.
Validation
Validate each check against a known scenario:
- Simulate a missing feature and confirm the missing-rate alert fires.
- Feed a shifted distribution and confirm drift crosses the threshold.
- Generate repeated invalid requests and confirm the security alert fires.
- Introduce latency or timeout spikes and confirm service degradation is detected.
If possible, replay historical production data with injected faults before relying on live traffic.
Common failure
A common mistake is treating all drift as dangerous. Some drift is normal, especially after feature releases, seasonal behavior changes, or controlled canary rollouts. Your pipeline should distinguish expected change from unsafe change by using model version context and deployment metadata.
Store and protect monitoring data
Goal
Keep monitoring data available for analysis while protecting it from unauthorized access and unnecessary retention.
Action
Apply storage controls based on sensitivity:
- Encrypt data in transit and at rest
- Use separate credentials for producers, readers, and admins
- Restrict access to the smallest possible role set
- Retain raw events for the shortest practical period
- Aggregate or anonymize data for longer-term trends
- Audit reads, exports, and administrative actions
- Protect backups and replicas with the same controls as primary storage
If you store both operational metrics and security events, classify them separately. Security events often need stricter access and longer audit trails than standard performance metrics.
Expected output
A storage layer that supports analysis and incident response without creating a new data exposure problem.
Validation
Verify that:
- Unauthorized users cannot read raw monitoring data
- Queries return only the fields intended for the consumer
- Retention policies delete expired raw records
- Backup access is restricted
- Audit logs capture administrative access
Common failure
Many teams secure the model but leave monitoring buckets or log indices broadly readable. That creates a secondary leak path because monitoring data often contains the exact feature values and request patterns attackers want.
Create alerting rules that are actionable
Goal
Ensure the pipeline produces alerts that an operator can interpret and act on quickly.
Action
Define alerts around operational decisions, not raw metrics. Good alerts usually answer one of these questions:
- Is the model failing to serve?
- Is the model behaving differently from its baseline?
- Is the data stream compromised or incomplete?
- Is the service being probed or abused?
For each alert, define:
- Trigger condition
- Severity
- Owner
- Response window
- Suppression or deduplication rules
- Required context in the notification
A useful alert includes model version, affected feature group, time window, and recent baseline comparison. Avoid alerts that require a human to query three systems before understanding the issue.
Expected output
A small set of high-signal alerts routed to the appropriate on-call or incident channel.
Validation
Run alert tests with controlled faults. Confirm that:
- The correct alert fires
- The alert includes enough context to triage
- Duplicate events are grouped
- The owner receives the alert
- The alert clears when the condition resolves
Common failure
Alert fatigue is the fastest way to break a monitoring program. If every minor metric change pages someone, real incidents will be ignored. Tune thresholds and routing so that only meaningful deviations escalate.
Add lineage and traceability
Goal
Make it possible to connect an alert to the exact model, feature set, and deployment that produced it.
Action
Attach these identifiers to every monitored event and aggregate:
- Model name and version
- Feature schema version
- Training dataset or training run reference, if available
- Deployment ID or release ID
- Environment identifier such as dev, staging, or prod
- Collector or pipeline version
This lineage allows you to answer questions like whether a drift alert started after a feature release or whether a security anomaly affects only one deployment group. If you need a repeatable workflow for model construction and validation, How to Build and Tune a Neural Network Classifier in Python can help you understand how training choices affect downstream monitoring signals.
Expected output
A traceable chain from model artifact to telemetry record to alert.
Validation
Pick one alert and verify you can trace it back to:
- The model artifact version
- The deployment that served the request
- The feature schema in use
- The owner responsible for remediation
Common failure
Without lineage, teams can detect a problem but cannot tell whether it came from the data pipeline, the model artifact, or the deployment change. That slows recovery and encourages guesswork.
Operate the pipeline with reviewable controls
Goal
Keep the pipeline safe and useful after the first deployment.
Action
Run a recurring operating routine:
- Review threshold performance weekly or after a release
- Re-baseline drift checks when the business process changes legitimately
- Rotate credentials and verify least privilege periodically
- Audit who can read raw events, export data, or mute alerts
- Track false positives and false negatives in incident reviews
- Reassess what data is allowed in telemetry as features evolve
Document a break-glass procedure for investigating incidents without permanently widening access.
Expected output
A monitoring pipeline that remains trustworthy as the model, data, and threat environment change.
Validation
Use a monthly or release-based checklist:
- Are the alerts still relevant?
- Did a deployment change the baseline?
- Are any collectors or jobs failing silently?
- Did access permissions drift?
- Are raw records still retained only as long as needed?
Common failure
The pipeline is often treated as a one-time setup. In reality, monitoring definitions become stale as soon as the model, features, or traffic patterns change. Stale rules produce either blind spots or noise.
Reference implementation checklist
Use this checklist to verify the finished state before production use:
- Telemetry is structured, minimal, and versioned.
- Sensitive fields are redacted, tokenized, or excluded.
- Inference events are validated before storage.
- Drift, missingness, latency, and error checks are implemented.
- Security anomaly checks are implemented.
- Monitoring storage is encrypted and access-controlled.
- Alerts are deduplicated, contextual, and owned.
- Model lineage is attached to events and aggregates.
- Retention and audit policies are documented.
- Fault injection or replay tests confirm the pipeline detects the expected issues.
If any of these items are missing, the pipeline is not ready for production, even if dashboards are already populated.
Final takeaway
A secure ML model monitoring pipeline is not just a metrics sink. It is a controlled workflow that validates telemetry, protects sensitive data, correlates signals with model lineage, and turns drift or abuse into actionable alerts. Build it with minimal data, strict validation, clear ownership, and repeatable tests, then re-check those controls whenever the model or traffic changes.
Use this guidance together with interactive rebase merge conflicts to connect the workflow with related operational context already available on the site.
Part of the Programming: AI / Machine Learning Insights content cluster.